|
Below is a copy of an email sent to Tower Hamlets Cabinet on Friday 2nd September before Cabinet on the 6th September, it refers to these cabinet reports found in section 5.3 on this link here read the report here first as it is the report I refer to below.
Dear Cabinet members, In advance of the cabinet meeting Tuesday I attach a submission on why on the surface the 20mph blanket speed ban is not working and should not be made permanent without more testing & analysis. Summary The evidence of collision data and residents surveys suggest that the blanket ban has not improved road safety and has only achieved an average reduction in speed of 1.4mph across Tower Hamlets and on some roads has resulted in higher speeds. The suggestion that the reduction of fatal & serious collisions at road junctions is entirely due to the reduction in speed is not backed up by evidence which should be readily available from public records but is not presented in the Cabinet report. My own analysis suggests otherwise. The number of collisions has though increased in total, on main roads and in residential areas according to the report. However analysing the Cabinet report would suggest that there is not enough information on which to make a decision over making the 20mph blanket speed ban permanent and that the test should be extended into 2017 except for those roads it recommends should return to 30mph. In the mean-time the information gaps in the report outlined below should be rectified so that a better informed decision can be made in 2017. This report should also be the start of a process to improve road safety not an isolated decision. Detail On the surface it appears as if the 20mph blanket speed ban has made the roads of Tower Hamlets less safe and many residents have told me what the surveys confirm, that the roads feel less safe than before not least because they see little reduction in speeds. The table showing the increase in collisions on the road space between junctions (links in the report) is worth repeating as this the road space where vehicle speeds will be at their highest. The increase in fatal collision’s up 33%, slight collisions up 27% and those involving pedestrian up 51%. Serious and cycle collision’s no change. That would indicate that the 20mph has decreased road safety on the road space where vehicle speed is a factor. The survey conducted by Tower Hamlets Council in May & June 2016 show that the majority of respondents do not agree that it makes the roads safer with 57% answering no they are not in favour of 20mph limits generally across London and 53% disagreed with the proposals to make the experimental 20mph limit on borough roads permanent. I have done my own survey using Surveymonkey (see attached) in August which reinforces this finding but with stronger results. I started it after I asked in the July Council meeting for a summary of survey results but was instead given information on collisions stats which are not replicated in the report. In my survey when I asked “Do you think Tower Hamlets roads are safer since the introduction of the 20 mph speed limit last April?” this is what I got from 446 responses; Yes, much safer 4.72% Yes, a little safer 6.97% I have noticed no change 34.83% No, a little more dangerous 19.55% No, they are more dangerous 33.93% In the Cabinet paper its says this; Para 3.2 Successful 20 mph zones and 20 mph speed limits should be self-enforcing, …. To achieve compliance there should be no expectation on the police to provide additional enforcement beyond their routine activity, unless this has been explicitly agreed. How can a successful 20mph zone be self-enforcing if it does not have broad public support? Especially if that 20mph speed test was never properly discussed or consulted upon before it started, being one of the last decisions made by Mayor Lutfur Rahman and with implementation taking place in-between his removal and the election of a new Mayor. You cannot change driving culture top down, without public engagement, without major physical changes and without police enforcement. The data shows that in total collisions have increased by 15%, they have increased by 35% in residential streets and a 20% increase in the roads in-between junctions where you would expect road speeds to be at their highest. And although average speeds have reduced it is only by 1.4mph and on some roads speeds have actually increased. But collisions at junctions have decreased by 13% which is attributed to the lower speed limit but this makes little sense. Generally, at junction’s vehicles are either stopping for a red light or slowing down to turn. Average vehicle speeds at junctions will therefore be lower than on the surrounding road spaces. But since most fatal & serious collisions happen at junctions this is used to justify the claim that the lower speed limit has been a success because fatal accidents fell 20% and serious accidents fell 22% this is used to justify that the blanket speed ban is a success. Again this makes little sense, for example we know many cyclists are killed by HGV’s turning left at junctions, this is not a speed issue but a truck visibility and junction design issue. And this is where we have the first problem with the lack of data which means the whole report is not providing us with enough information to make a decision. Mercifully the number of fatal and serious collisions is low (1.3 fatal & 33.3 serious in the post period) so it should be possible to analyse those accidents and work out whether speed was the main or contributory cause. But that information is missing from the report. I have attempted to use the www.crashmap.co.uk website to do my own analysis which suggests I am on the right lines in believing that accidents at junctions are not primarily speed related but that site only provides limited information. I have asked for the detail on accidents but have not received it. I believe that the report does not contain enough information on which to make a permanent decision in September 2016 and that you should extend the test period until you have it and can then make a permanent decision on a sound data. The most important factor is that the report uses the 1st April 2015 to 31st December 2015 as the after period for analysis. There are several fundamental issues with this;
You need I believe a full 12 month set of road data to analyse post implementation results and 2015 is a mess due to the phased implementation and awareness of the 20mph test during the year. I think you need to wait until 2017 when we have a complete set of data for 2016 in order to do the analysis and then compare that data to 2014 and earlier years. You should probably repeat in March 2017 the road speed test as well. There are some other critical issues not fully raised in the report;
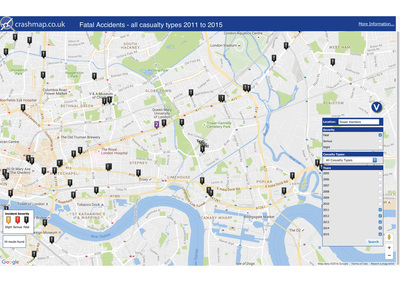
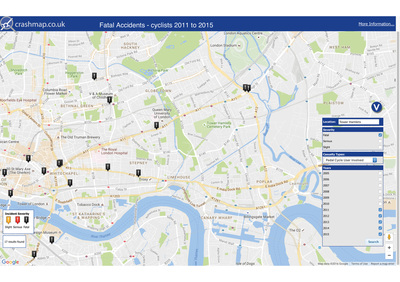
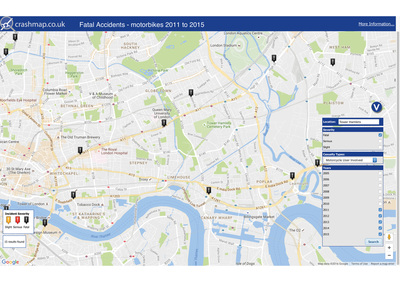
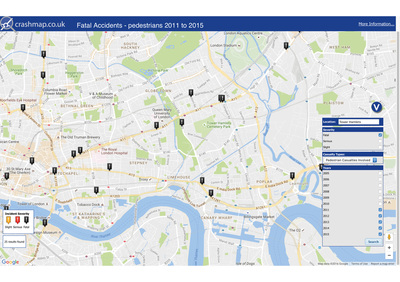
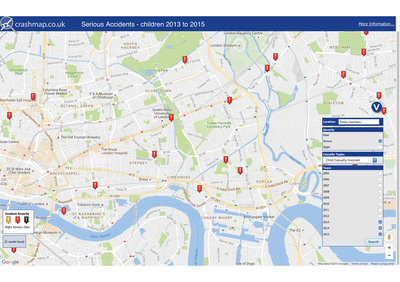
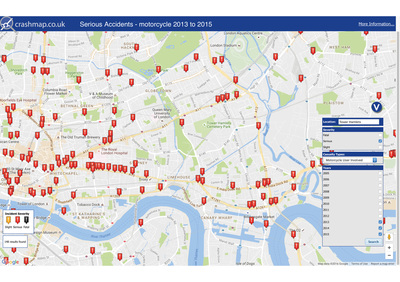
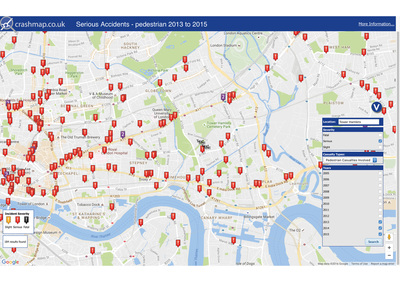
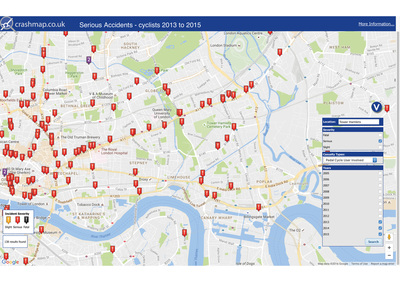
To travel to and from work 31.22% For work, for example you use it to move between jobs or to carry tools 12.69% To carry family members around like young children or elderly parents 39.34% You or somebody in your family is disabled or are unable to walk long distances 11.68% Shopping & running errands which you could not do on public transport 67.26% Leisure use only 35.53% What is also missing from the report is how the different surveys were advertised which affects the responses; First Council survey in 2014 received only 171 responses of which 103 where from a cycling website versus 43,589 vehicle owners in TH, why was the response rate so poor? Perhaps because it was so poorly communicated, I only became aware of it after it closed and I was a Councillor! Second survey in 2016 received a better response with 904 responses. But it received disproportionate response from the E14 postcode 58% of total. This was because the Council survey was heavily re-advertised within the E14 community via social media & by email. This does not appear to have happened in other parts of TH, why? Arguably that makes E14 responses more accurate as it has a higher % uptake but is also affected by inclusion of A-road (Preston’s, Westferry & Manchester) within the 20mph zone. I have been talking to Adam Bunce at www.2020consultancy.co.uk who has made some interesting observations about how to make 20mph work. He makes the good point that one of the best ways of assessing whether a road is suitable or not is to drive it at exactly 20mph. On a suitable road 20mph will feel comfortable whereas the unsuitable road will feel uncomfortably slow. He also emphasizes how important public engagement is which we have not done yet. Finally, you might find interesting :) the responses to this survey question I asked; Who do you think should make the decision on whether to end, amend or make permanent the 20mph speed limit ban? Pick one choice By Mayor John Biggs in a Cabinet meeting 7.99% In a full Council meeting after a full debate with all Councillors voting 23.29% Through a public referendum as happened in Wells, Croydon, York and Worthing 68.72% Let me know if you have any questions, The attachments below are screen shots from www.crashmap.co.uk showing the locations of different types of fatal and serious accidents on all roads including those controlled by TfL, not subject to 20mph, no 2016 data available. Also attached here is a summary of the survey I conducted. There were no fatal accidents involving children between 2011 & 2015 which is why not shown below.
0 Comments
Leave a Reply. |
Archives
May 2022
Categories |
 RSS Feed